
Circles is a great tool to explore all kinds of hierarchies and data breakdowns.
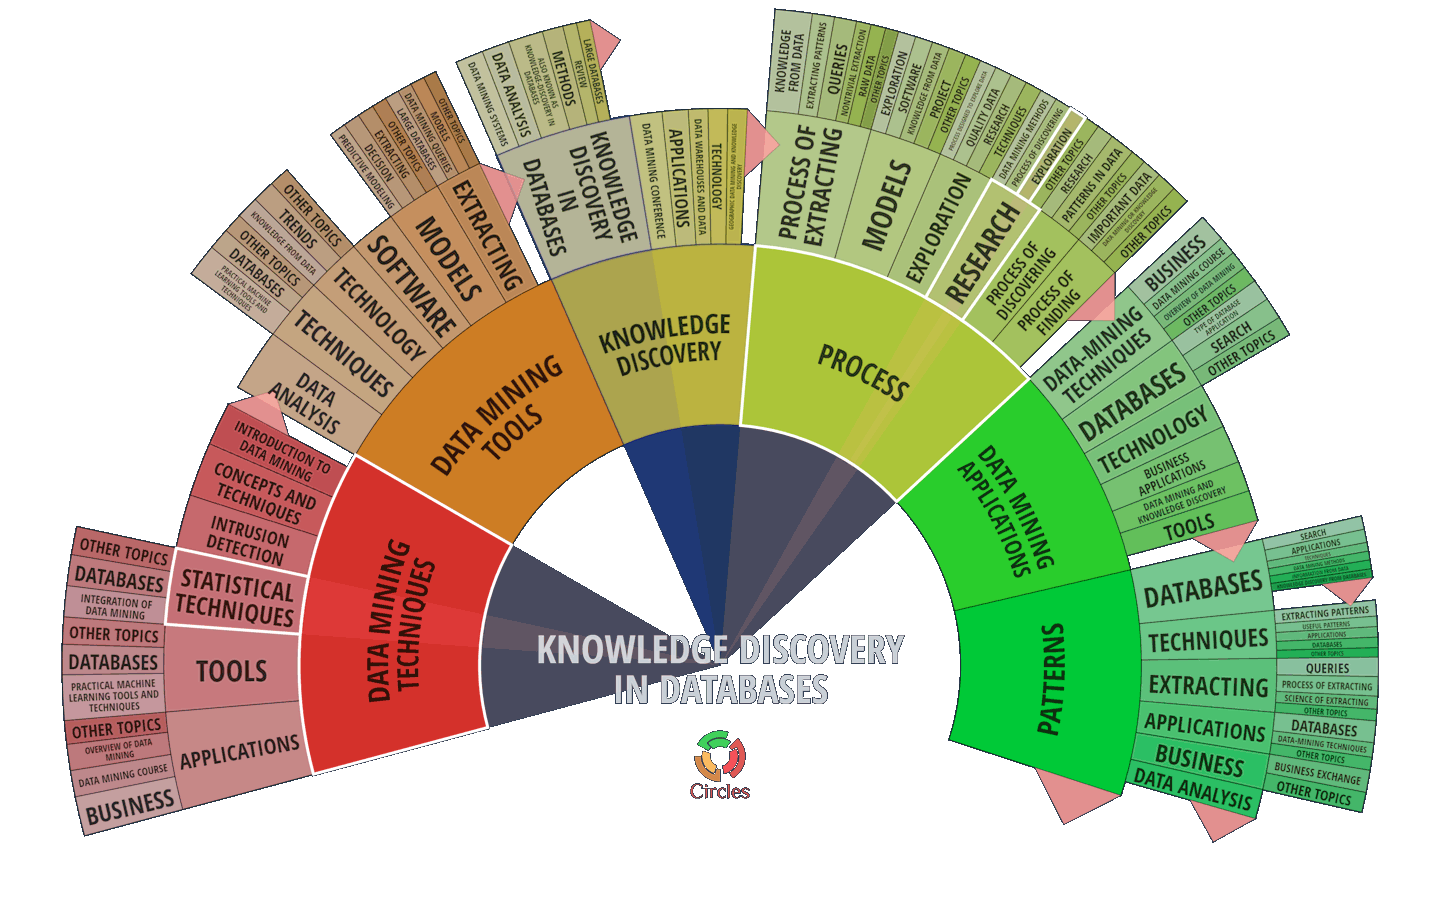
This screen shot is a visualization of 500 web search results for query data mining clustered into a 3-level hierarchy. Clustering of search results was obtained from the Lingo3G clustering engine on-line demo.
Effortless exploration of data breakdowns
Circles is an interactive visualization of multi-level data, such as numerical value breakdowns or tree-like structures. Written in JavaScript, for desktop and mobile.

Instant overview
Top-down overview of your data. Large groups, the smaller ones, all in one picture.

Rapid exploration
Explore the data points of interest using the zoom-in feature.

Great on desktop and mobile
Circles is a JavaScript component, works in any modern browser, desktop or mobile.

Export as JPEG or PNG
Save the visualization as an image you can embed in, for example, a Word document.

Complements Lingo3G
Add a new look and more interaction to clusters from Lingo3G or Lingo4G.

JavaScript API
Integrate Circles within minutes using a simple JavaScript API, 21k gzipped.
Superb results out of the box
Complex layouts and interactions require a little customization code. We can help with that.
Multi-level pie-chart
Visually pleasing hierarchical pie-chart with properly curved labels and rich interactions.
Circles is a visually pleasing hierarchical pie-chart with properly curved labels and rich interactions.
The screen shot shows Circles visualization of the 3-level cluster structure generated by Lingo3G for 500 web search results for query data mining. View the settings panel demo for the interactive version.
Zooming
You can zoom into one or more groups to inspect the contents more closely.
When you double click on a slice, it will expand to take more screen space and show its child slices in more detail.
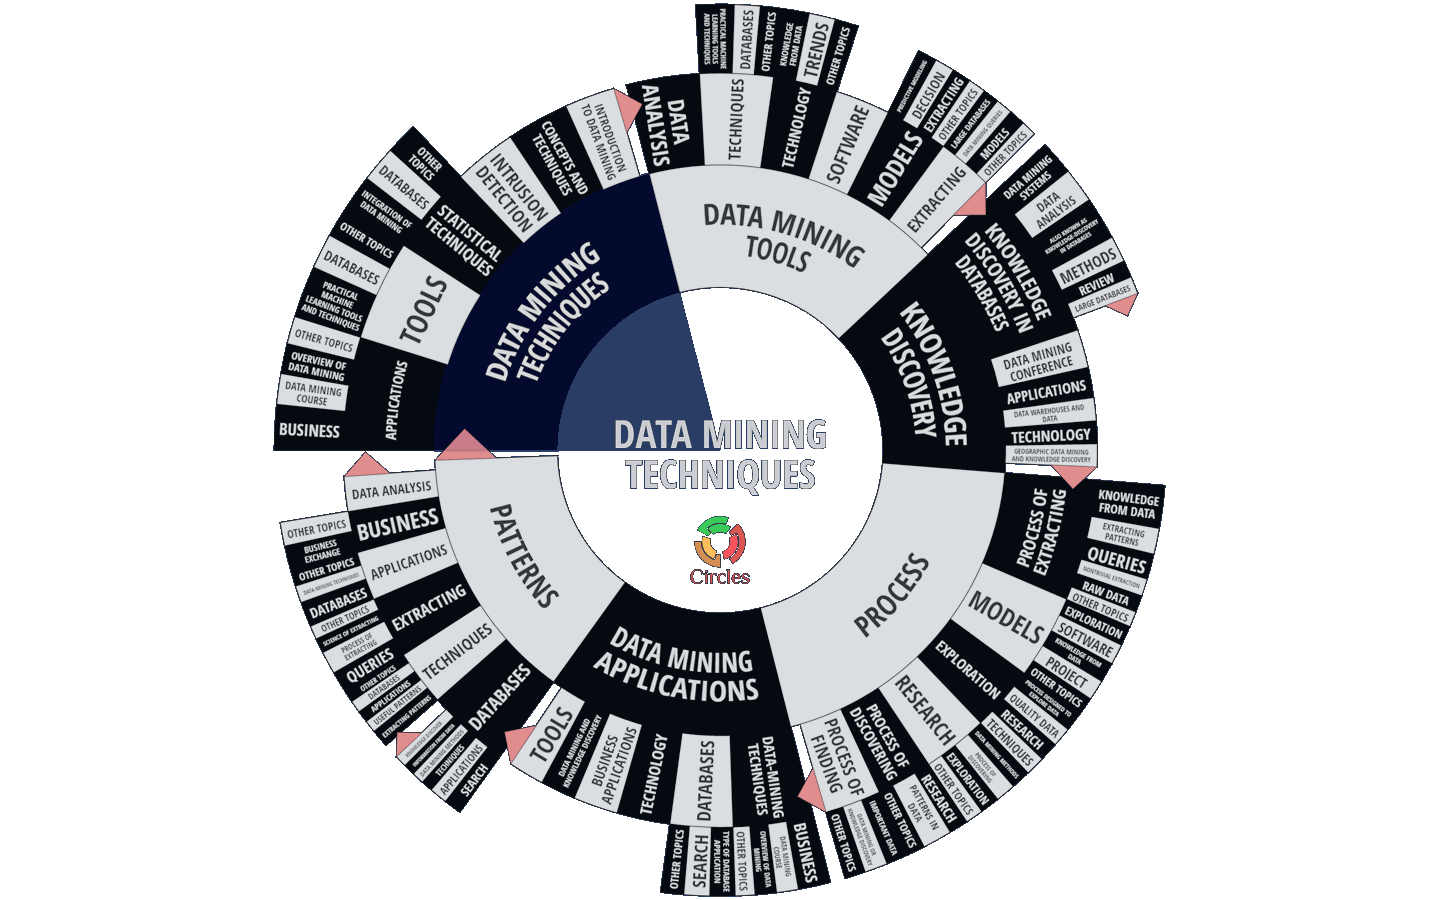
Configurable colors
By writing a few lines of code you can customize the colors of slices and labels.
You can color the slices and labels in your Circles visualization in an arbitrary way. All you need to do is to write a callback function that will return the color for each group.
The screen shot shows the settings panel demo with a zebra-stripes color callback enabled.
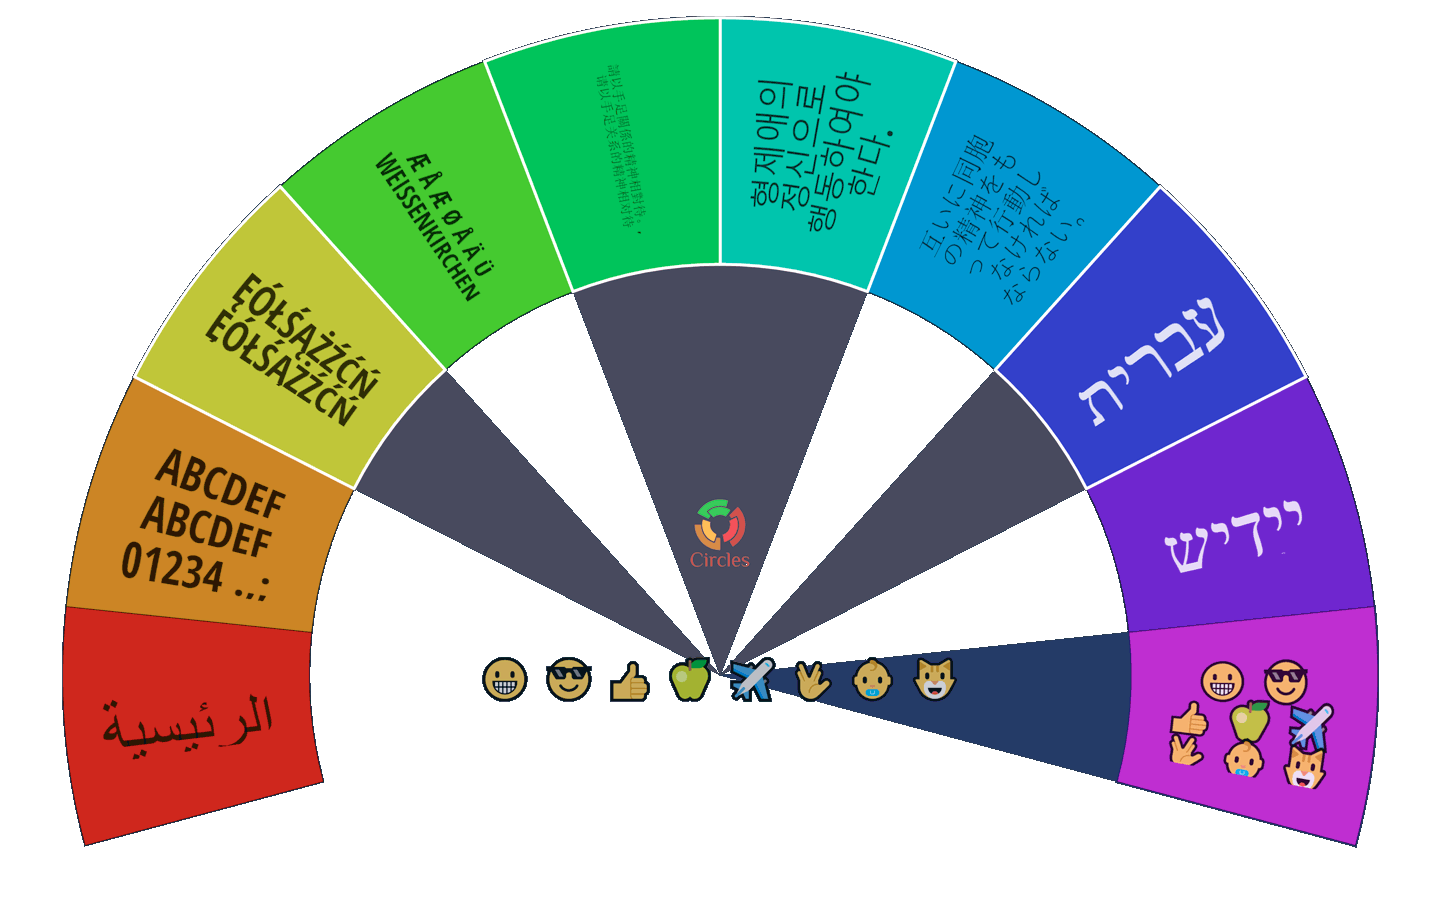
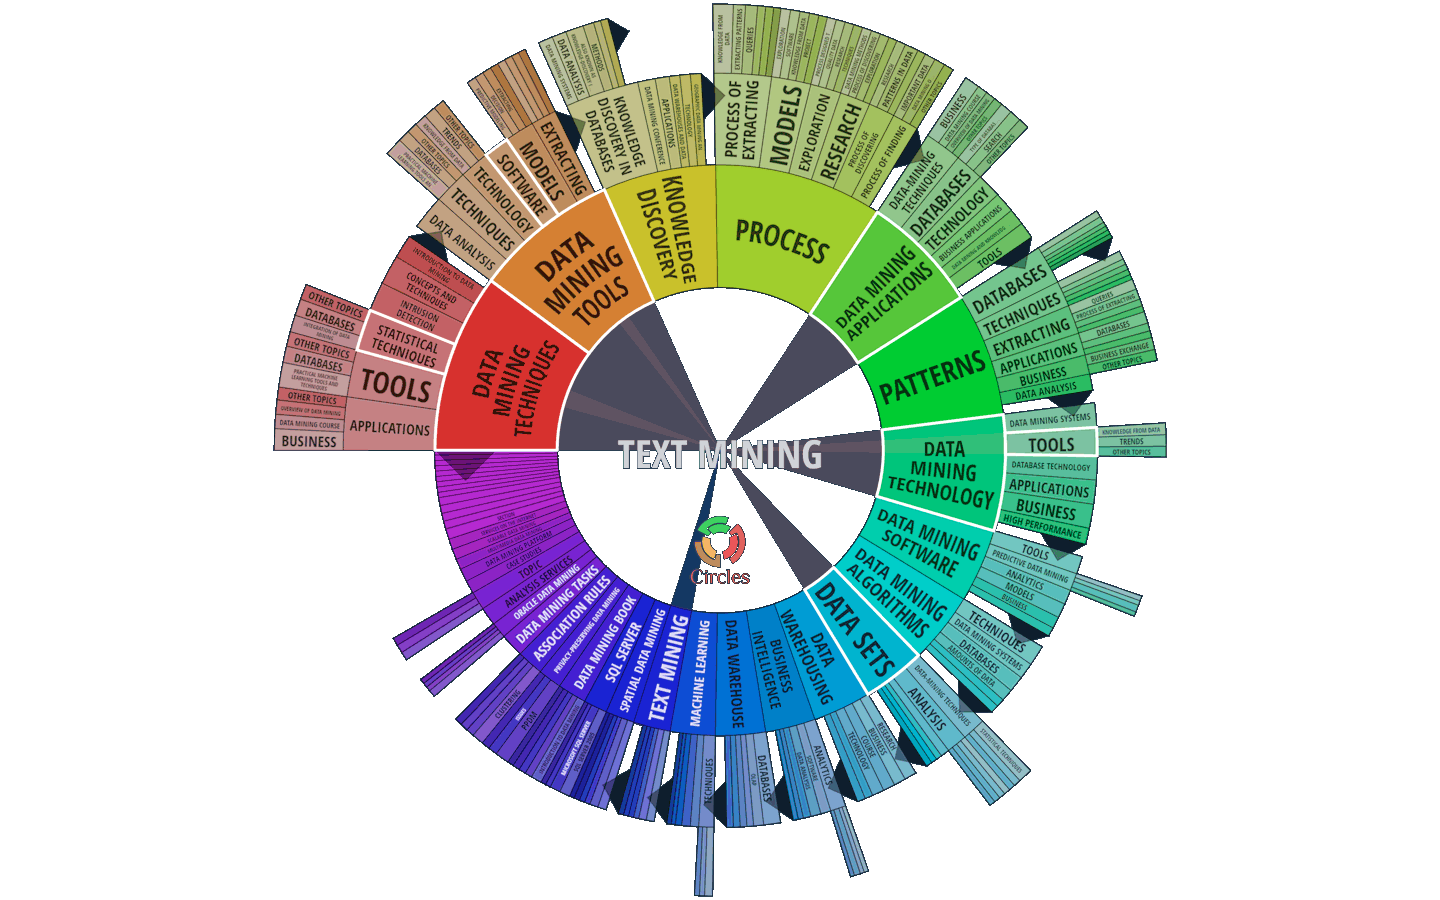
Multilingual and emoji-friendly
Supports all special characters your browser can display, including emoji.
FoamTree can display all the characters your browser can render, including Arabic, Chinese, Japanese, Korean as well as emoji.
View the settings demo and choose the multilingual data set there for an interactive version.
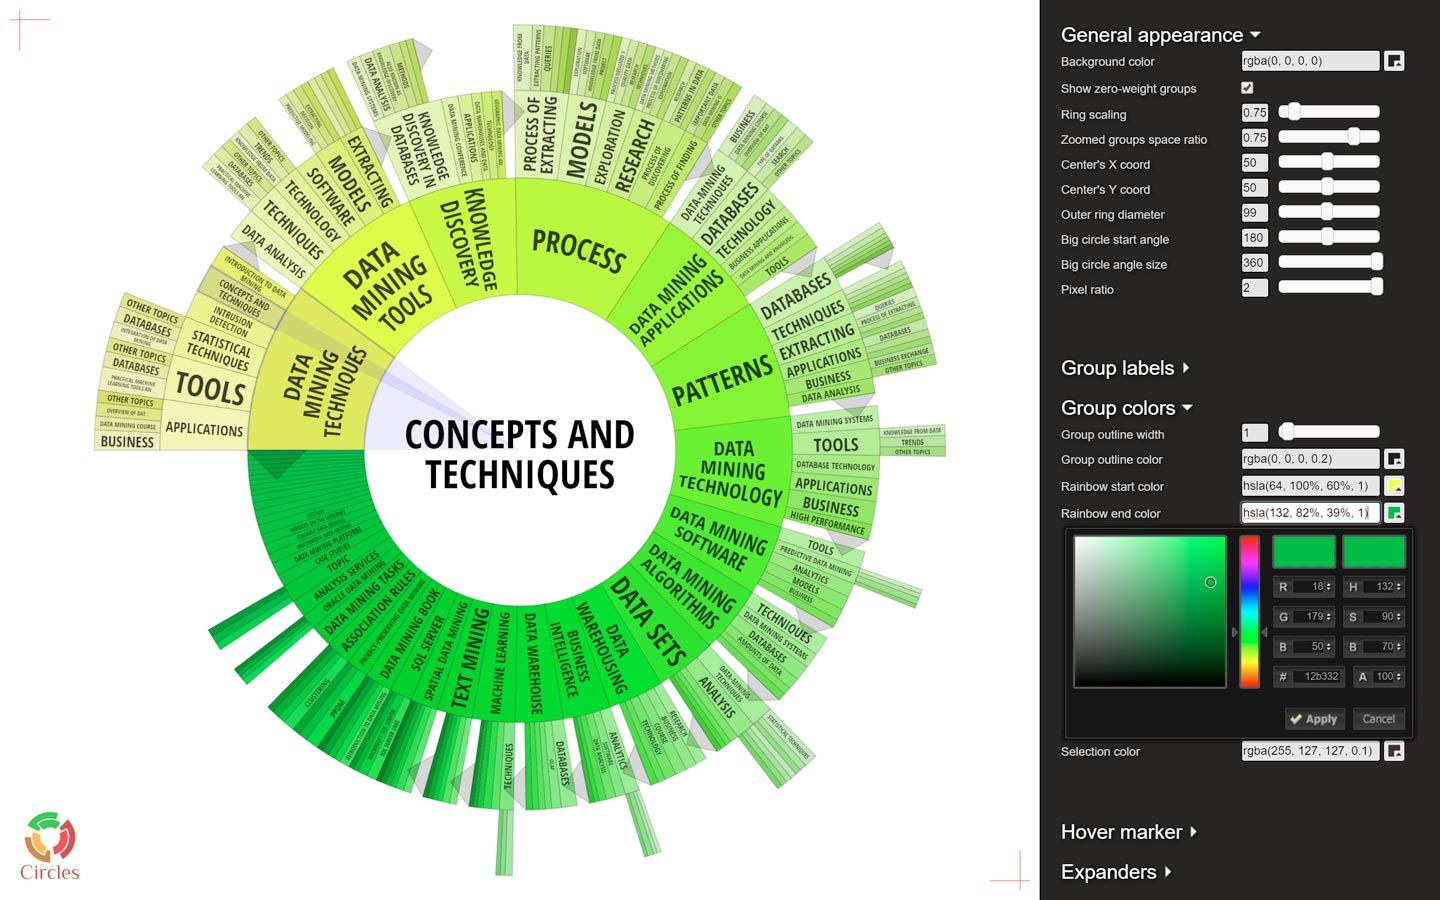
Extensive tuning
Settings panel for tuning of visual properties and exporting them to your code.
You can tune various aspects of the look and behavior of Circles, including colors, fonts, border widths, ring sizing, animation types and speeds.
The screen shot shows the settings panel demo with settings altered to color the slices based on a yellow-to-green gradient.
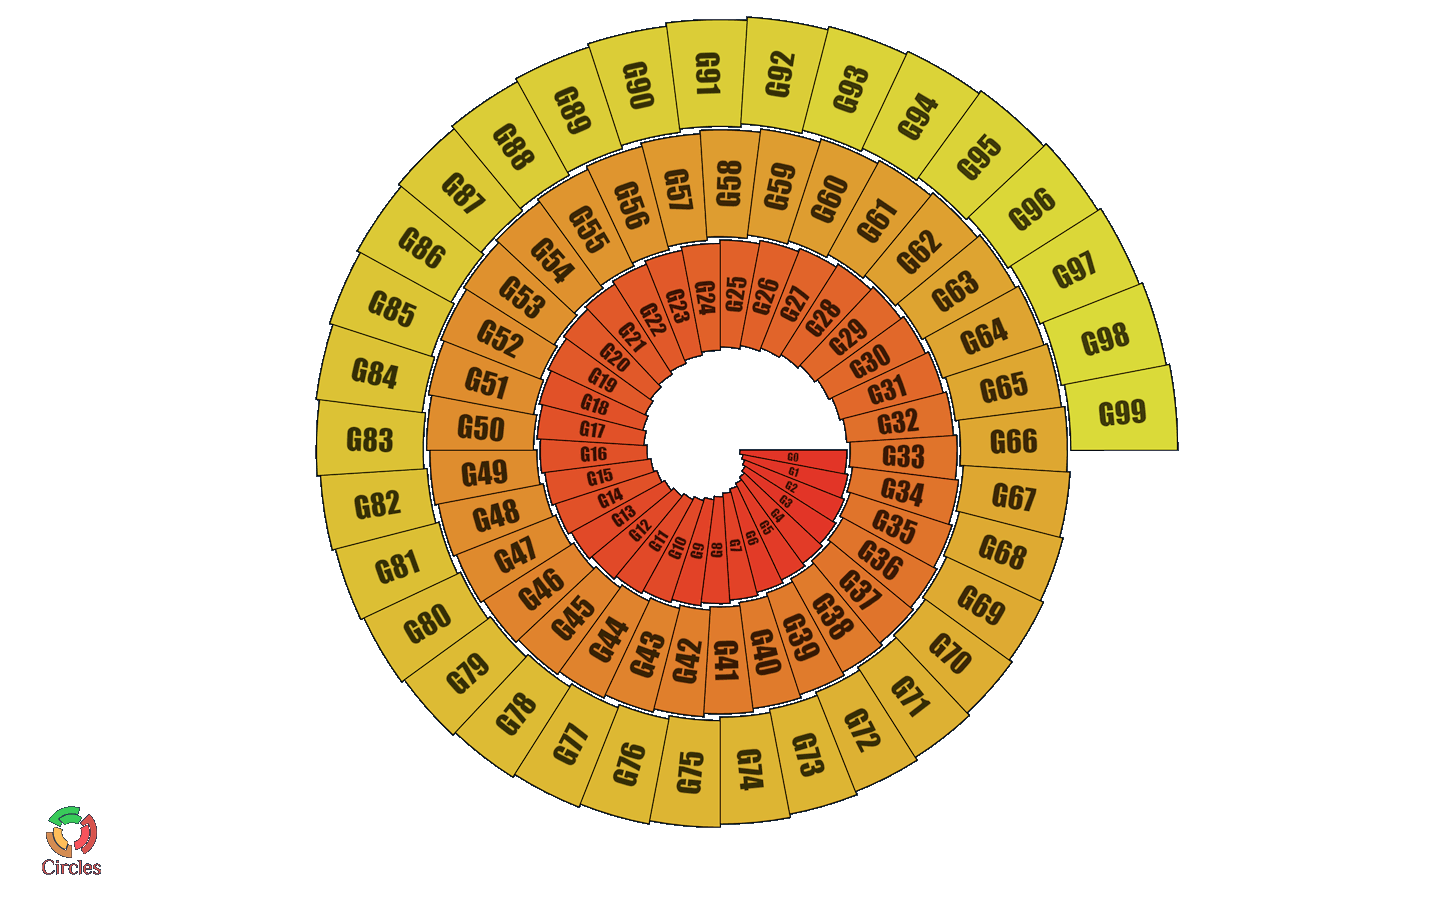
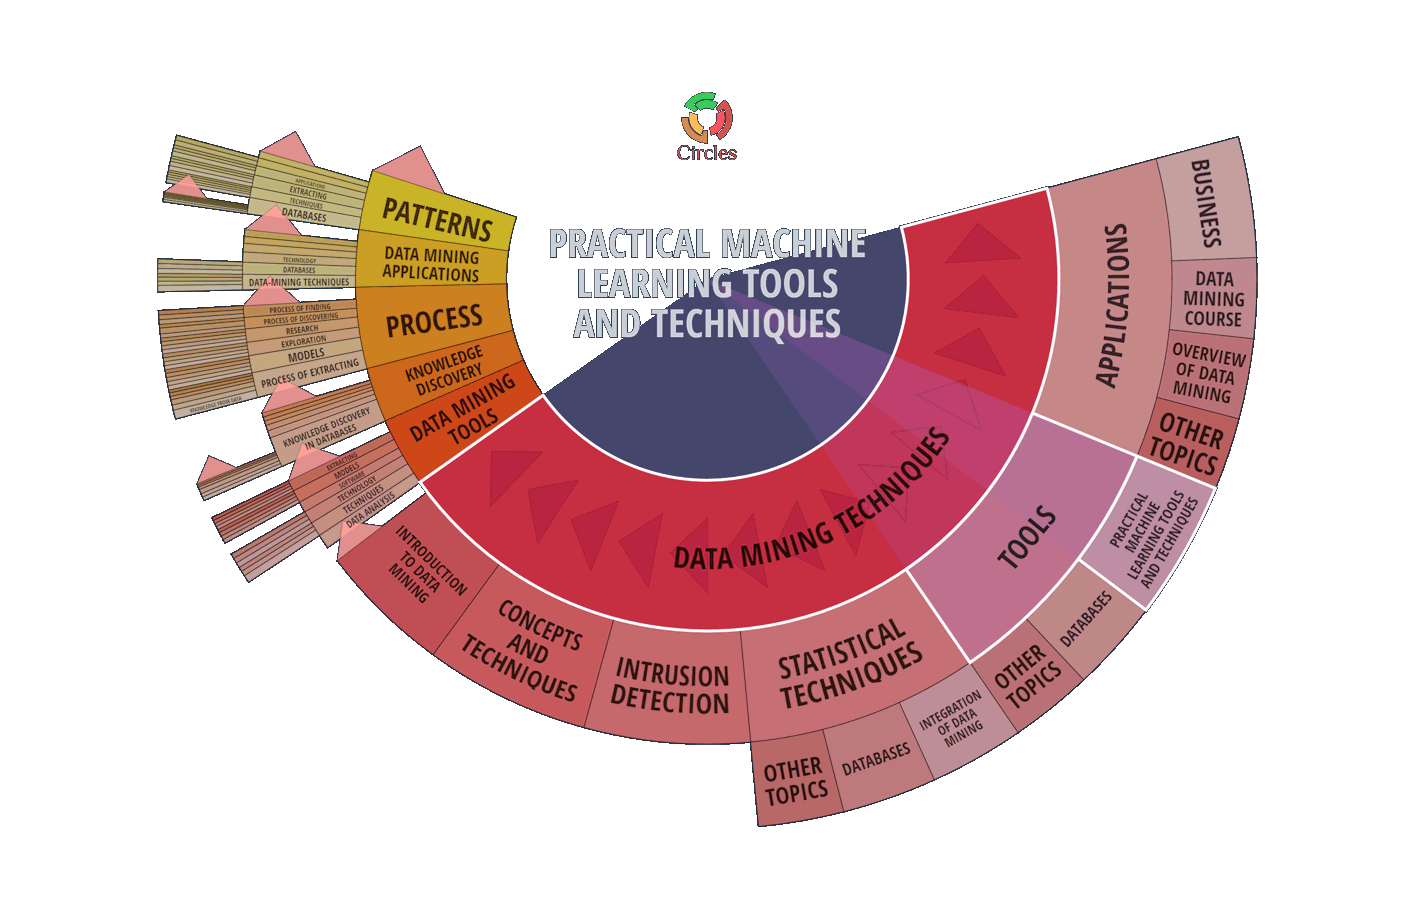
Layout customizations
By changing sizes of individual slices you can implement non-standard layouts.
You can write a small piece of code that governs the sizing of individual Circles slices and thus customize the layout of your pie charts.
The screen shot shows an example that abuses Circles API a little bit to create a spiral chart. Another great example of custom layout is the US demographics demo.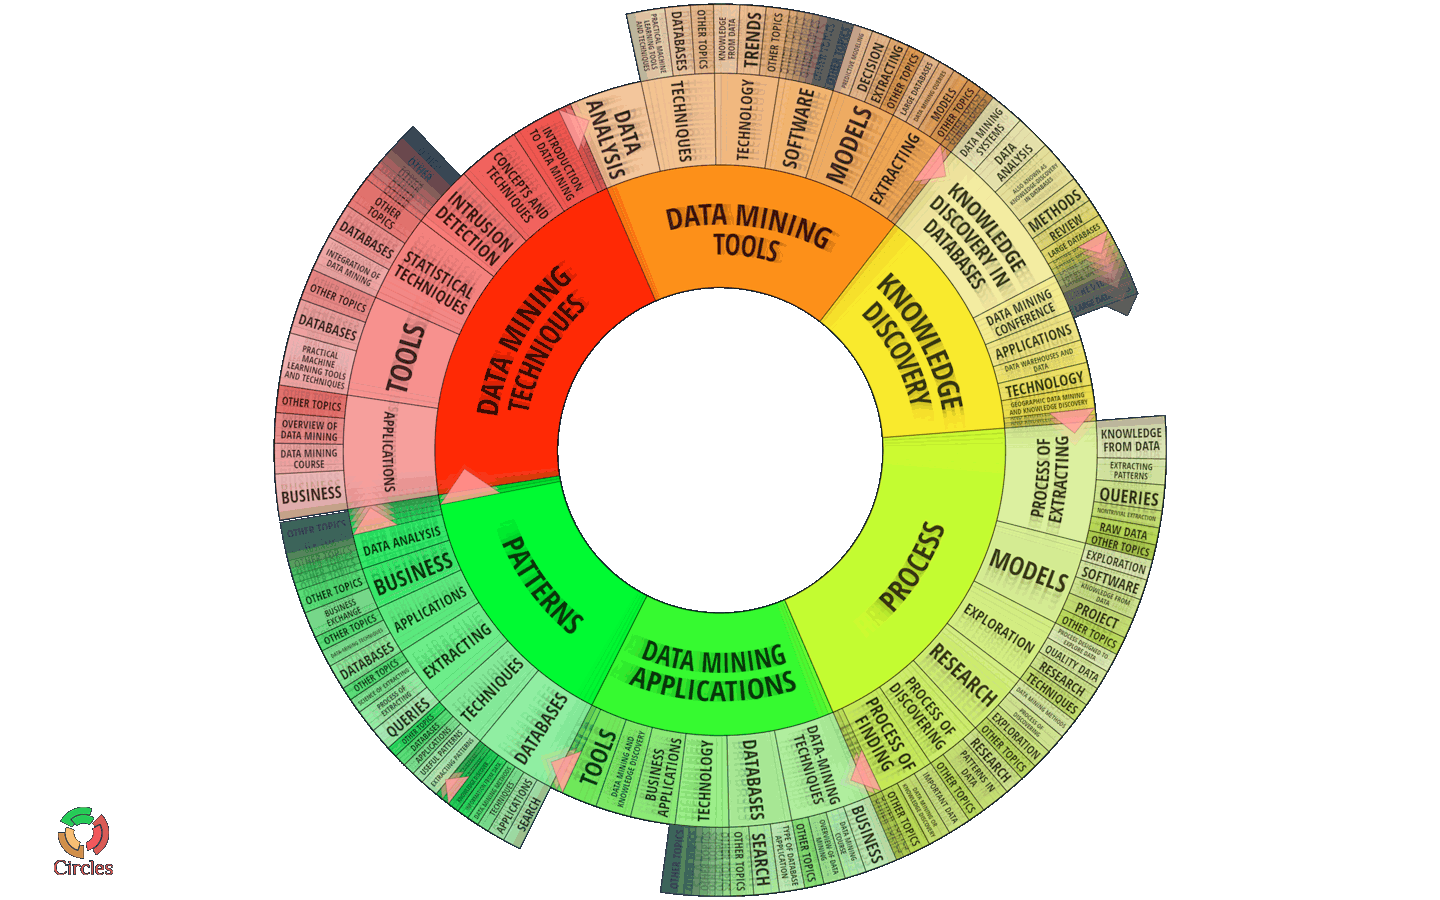
Animated interactions
Data can enter and leave the visualization stage in a number of animated ways.
Circles uses animated transitions for zooming, revealing and replacing the visualized data.
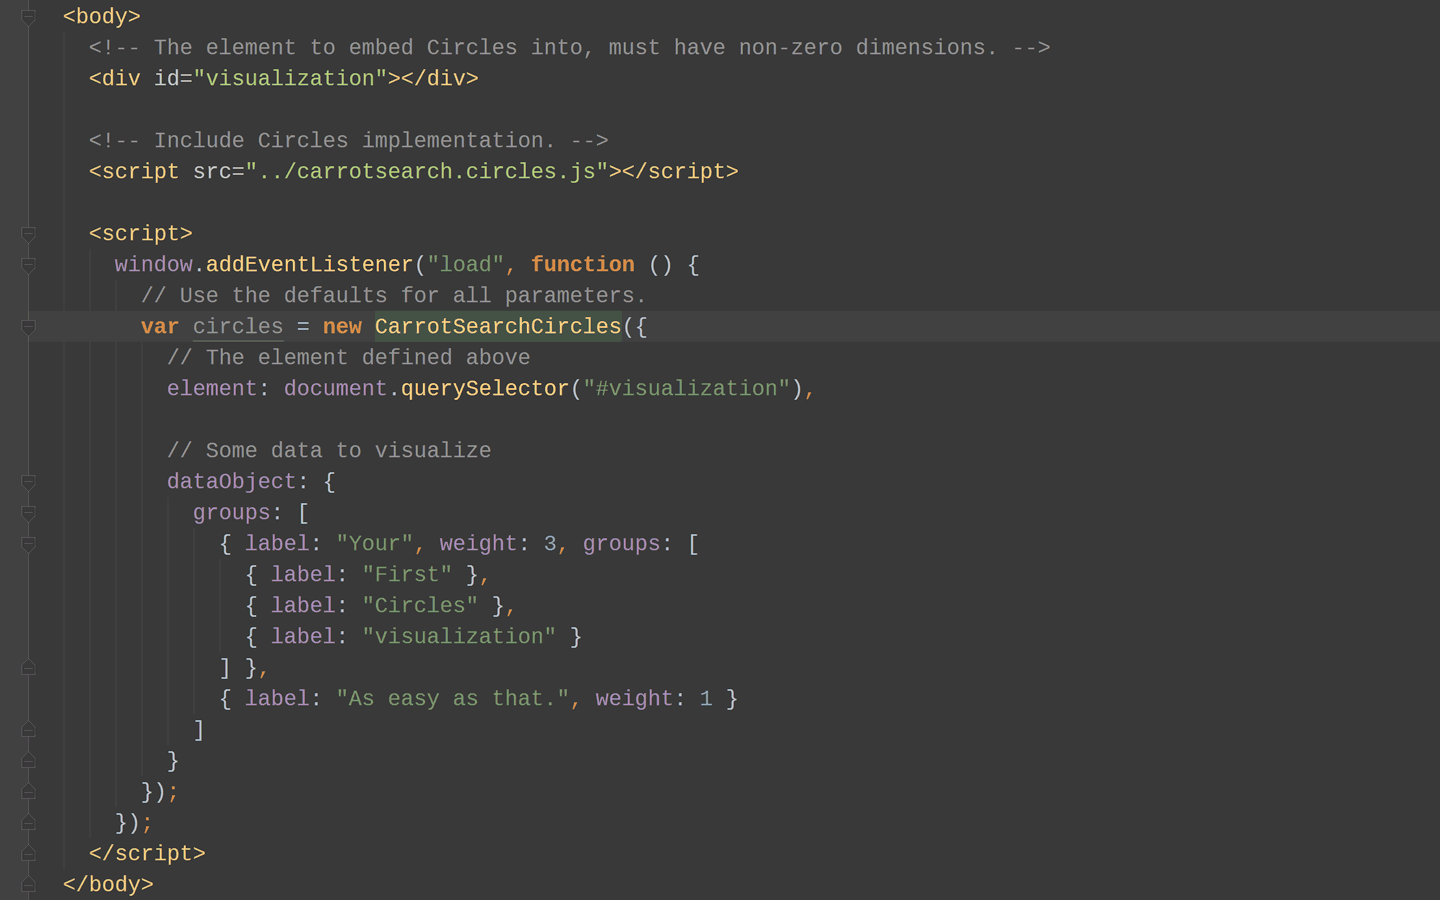
JavaScript and JSON API
Get started within minutes. Circles is a small JavaScript library, 25kB gzipped.
To get your first visualization, pass a HTML element and some data to Circles constructor. See Circles API reference for detailed documentation of all available options.

Questions & Answers
What are the requirements of Circles?
Circles requires JavaScript and HTML5 canvas support. It will work on any major browser, including Chrome, Firefox, IE10+, Edge and Safari.
Will Circles run on mobile devices?
Yes, Circles will run on Android and iOS phones and tablets. Touch-enabled laptops are also supported.
Does Circles require Lingo3G or Lingo4G to run?
No, Circles can be used independently of Lingo3G or Lingo4G. Of course, it will also be an excellent tool to visualize clusters you get from our clustering engines.
What hierarchy depth does Circles support?
There is no limit on the hierarchy depth, but all levels must fit on screen at the same time. For very deep hierarchies your code may need to show only a few levels initially and replace the visualization with lower levels on user's request.
How is Circles licensed?
The most common Circles licensing scenarios are for use in SaaS applications and Intranet deployments. We require one Circles license per one SaaS application, regardless of the number of servers handling the application and the number of users. Similarly, we require one Circles license per deployment in one Intranet, regardless of the number of servers and users.
Each license comes with 12 months of software maintenance, covering support and all upgrades. For non-typical deployment scenarios, such as OEM distribution, please get in touch.
What is the cost of a Circles license?
Please contact us for a quote.
Can I get a discount?
Yes, we offer a 50% discount for holders of valid Lingo3G or Lingo4G licenses.
Is there a free version?
Yes, you can use the demo version, which displays Circles logo, free of charge. The demo version is otherwise fully-functional.