
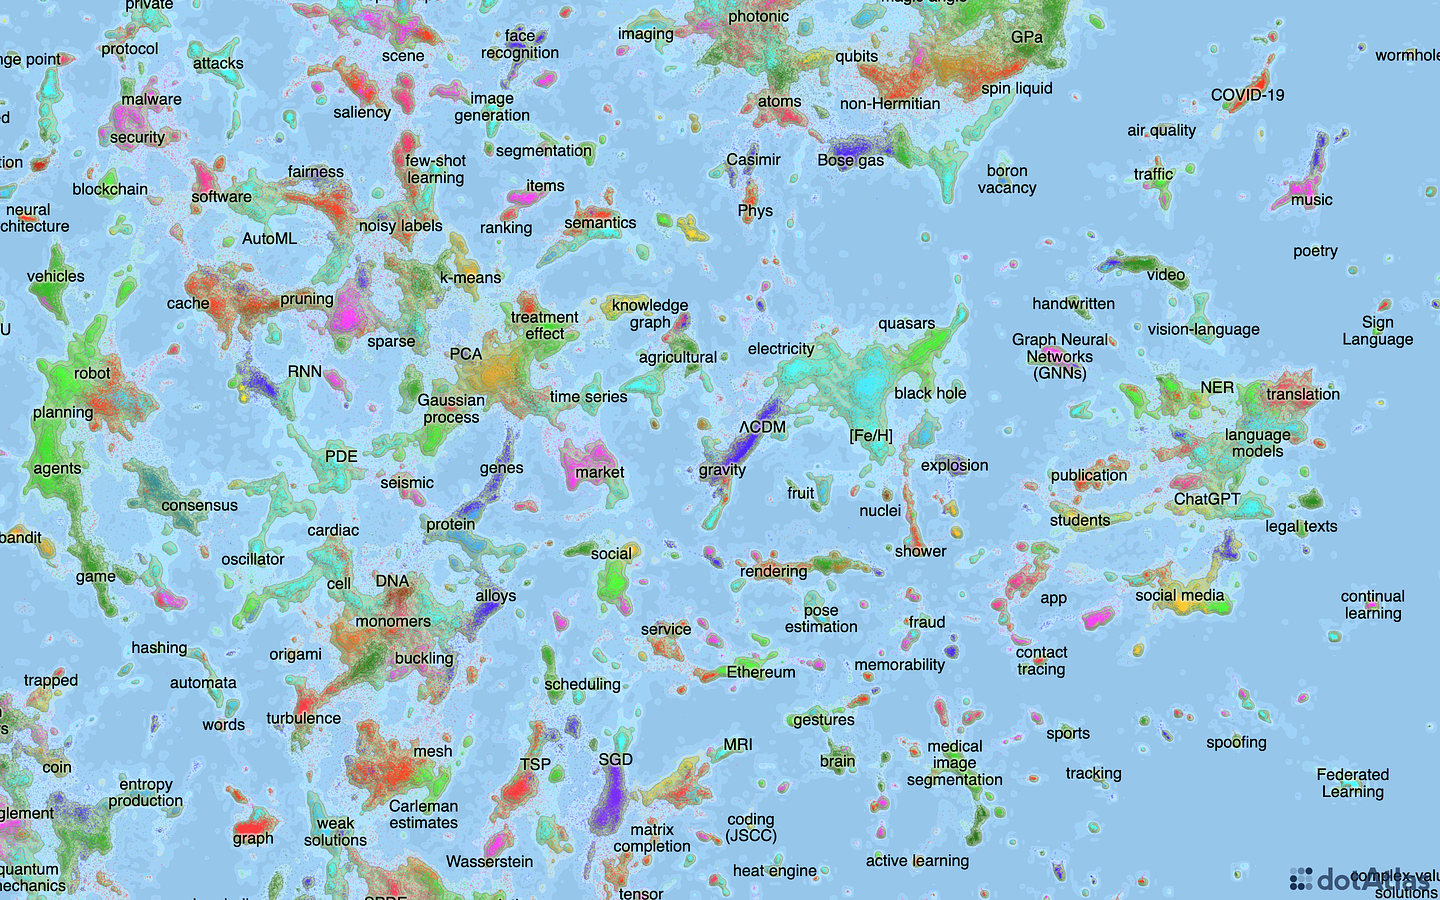
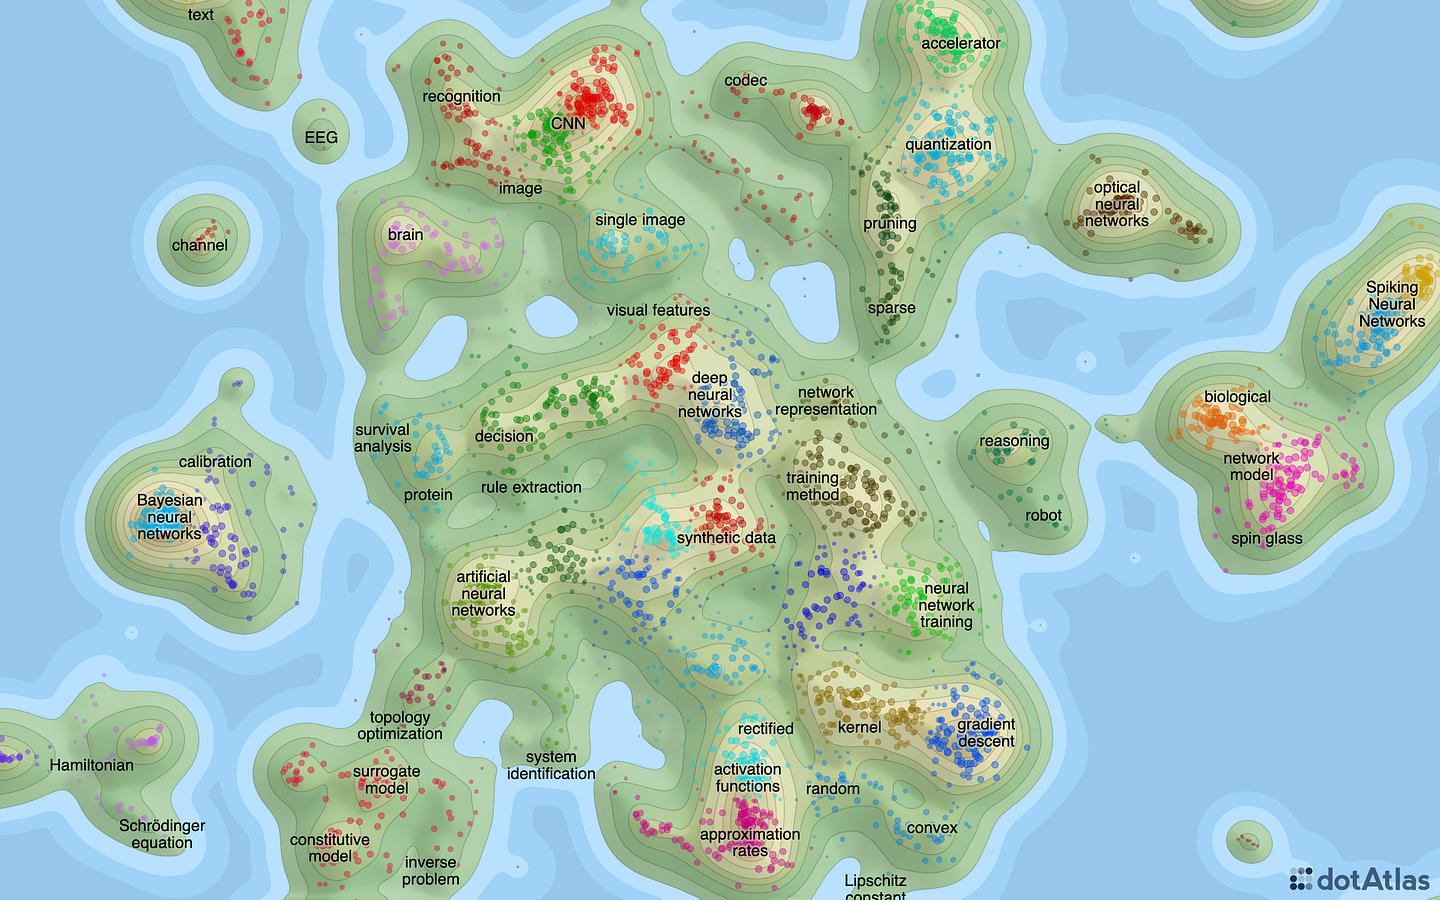
dotAtlas is a great tool to visualize and explore collections of 2D points. This screenshot shows a zoomed-in dotAtlas visualization of over one million arXiv paper abstracts.
The marker layer draws points representing individual papers, where the color corresponds to the cluster the paper belongs to. The label layer shows phrases describing various areas of the map. Finally, the elevation layer adds depth to the visualization by highlighing the densely populated areas.
dotAtlas visualizations are fully-interactive, including 60 FPS zooming and panning, allowing users to explore the data in detail.
Map-like visualization of 2D point collections
dotAtlas combines various types of layers, such as elevations, markers, or labels, for space-efficient interactive exploration of large 2D point collections.

For any data type
Visualize 2D points representing documents, words, or any other data.

For any embedding
Visualize 2D embeddings from UMAP, t-SNE, Lingo4G or any other algorithm.

For data clusters
Use colors to add cluster membership information to the visualization.

For production and research
Ready for production applications, great for research experiments.

Blazing fast
WebGL-based 60 FPS animations, even with millions of data points.

JavaScript API
Integrate dotAtlas within minutes using a simple JavaScript API.
Stack layers of different types into a stunning visualization
More complex visualizations and interactions require a little customization code. We can help with that.
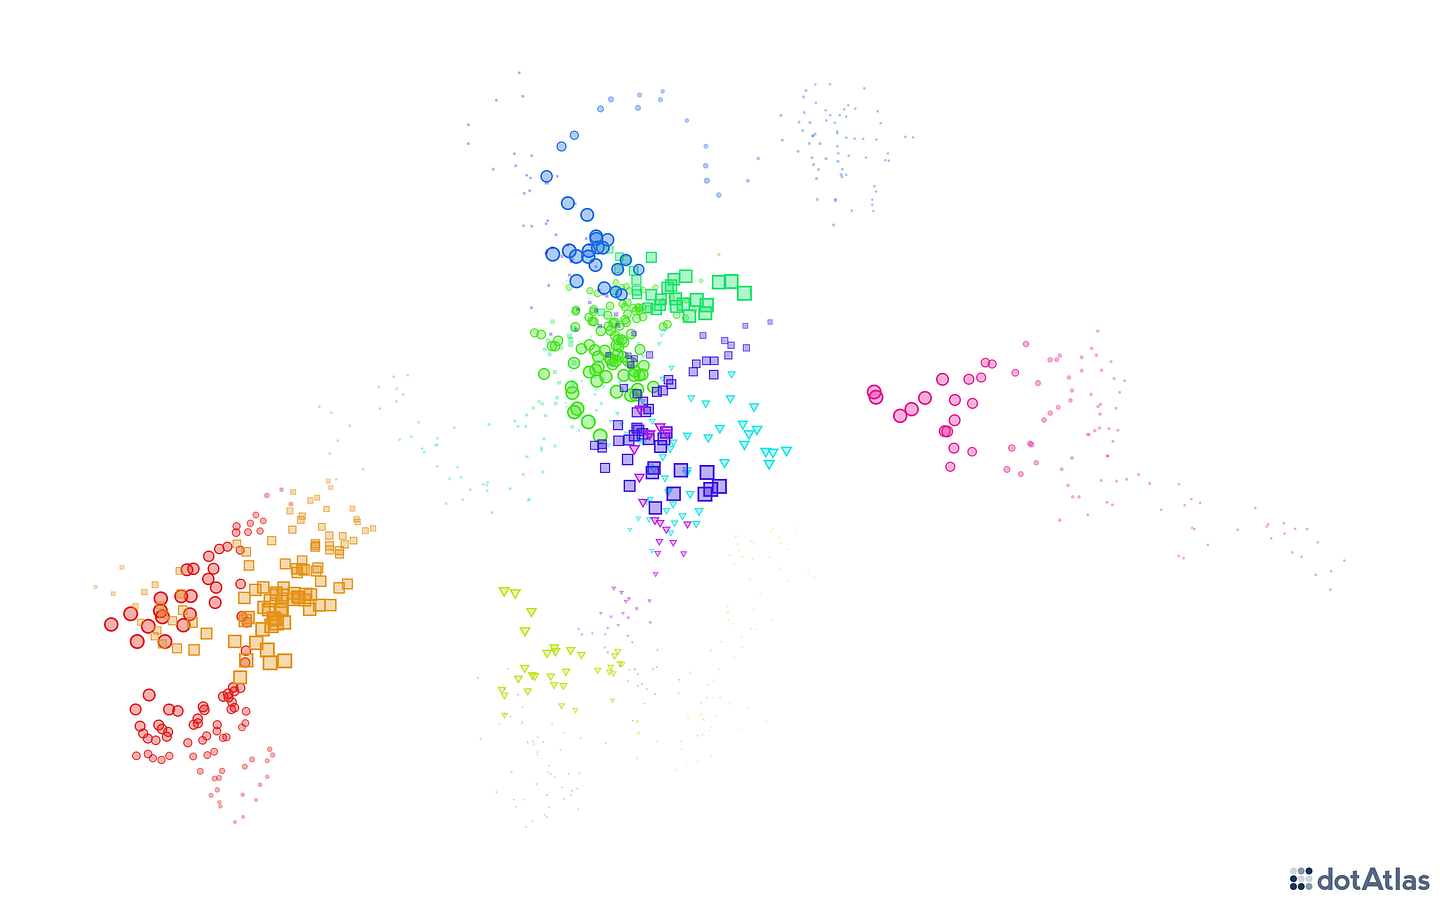
Marker layers
Display individual points as markers with custom per-marker colors, shapes, sizes, and opacities.
The marker layer displays points as markers on your map. You can customize marker properties like color, shape, size, and opacity to represent different attributes of your data.
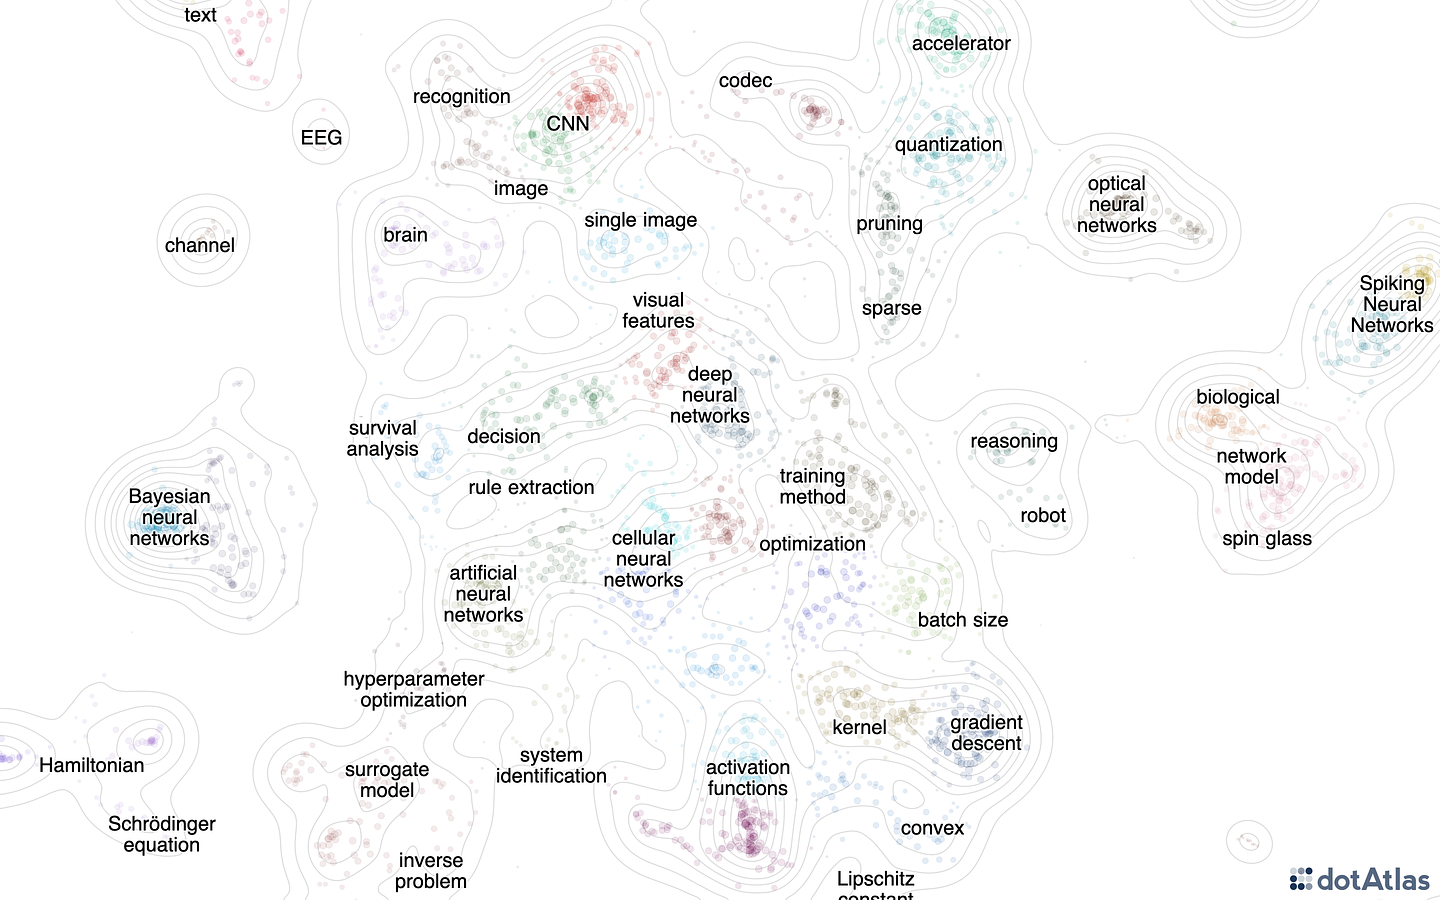
Label layer
Annotate groups of points with text labels with control over color, opacity, and display priorities.
The label layer adds textual annotation to your map. You can control label properties like color and opacity, and set display priorities so that the most important labels show at lower zoom levels.
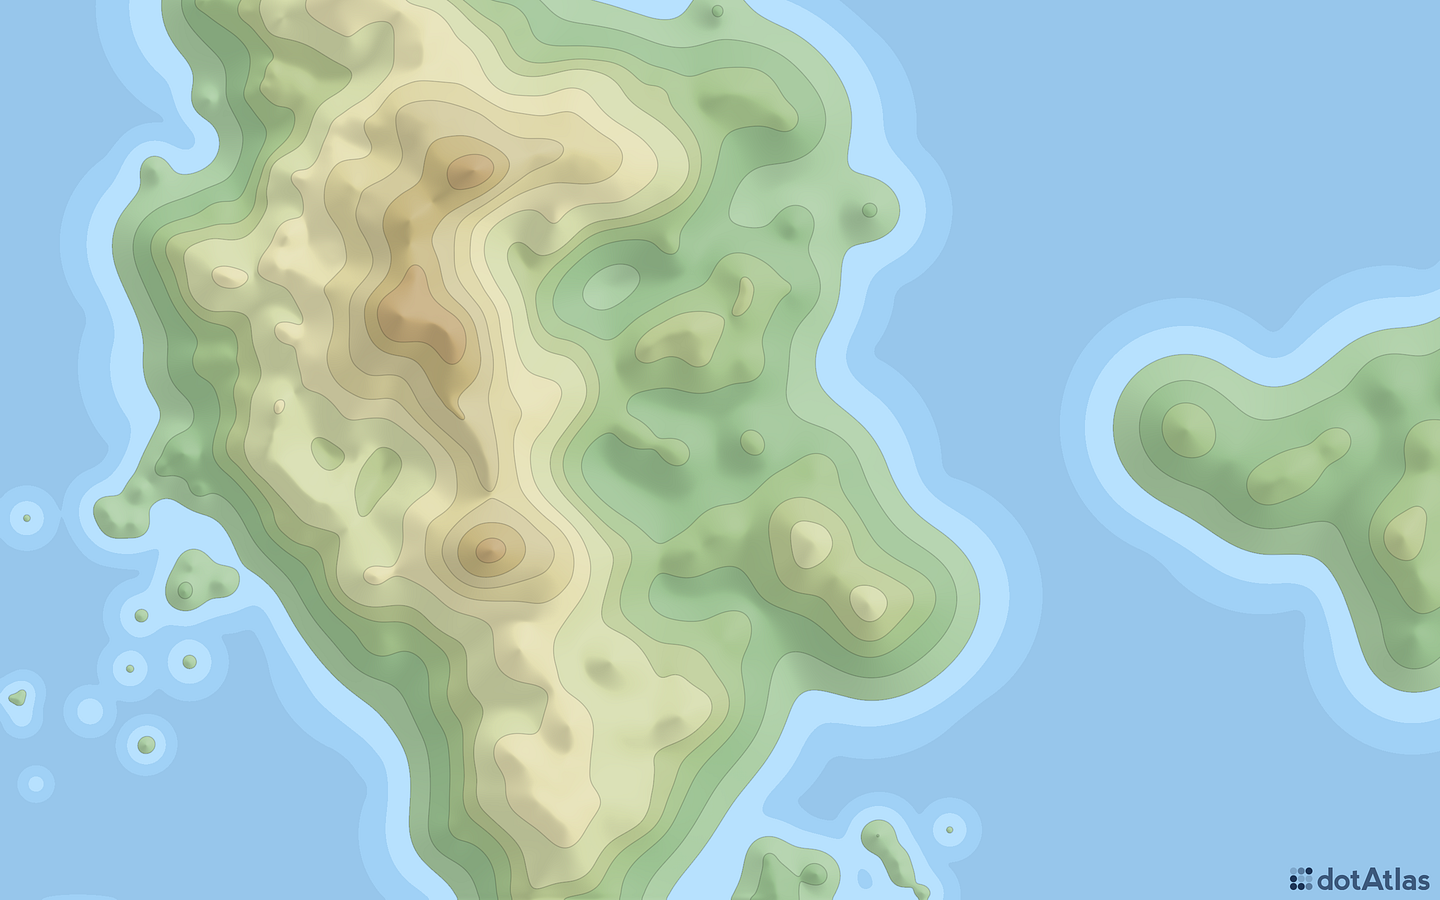
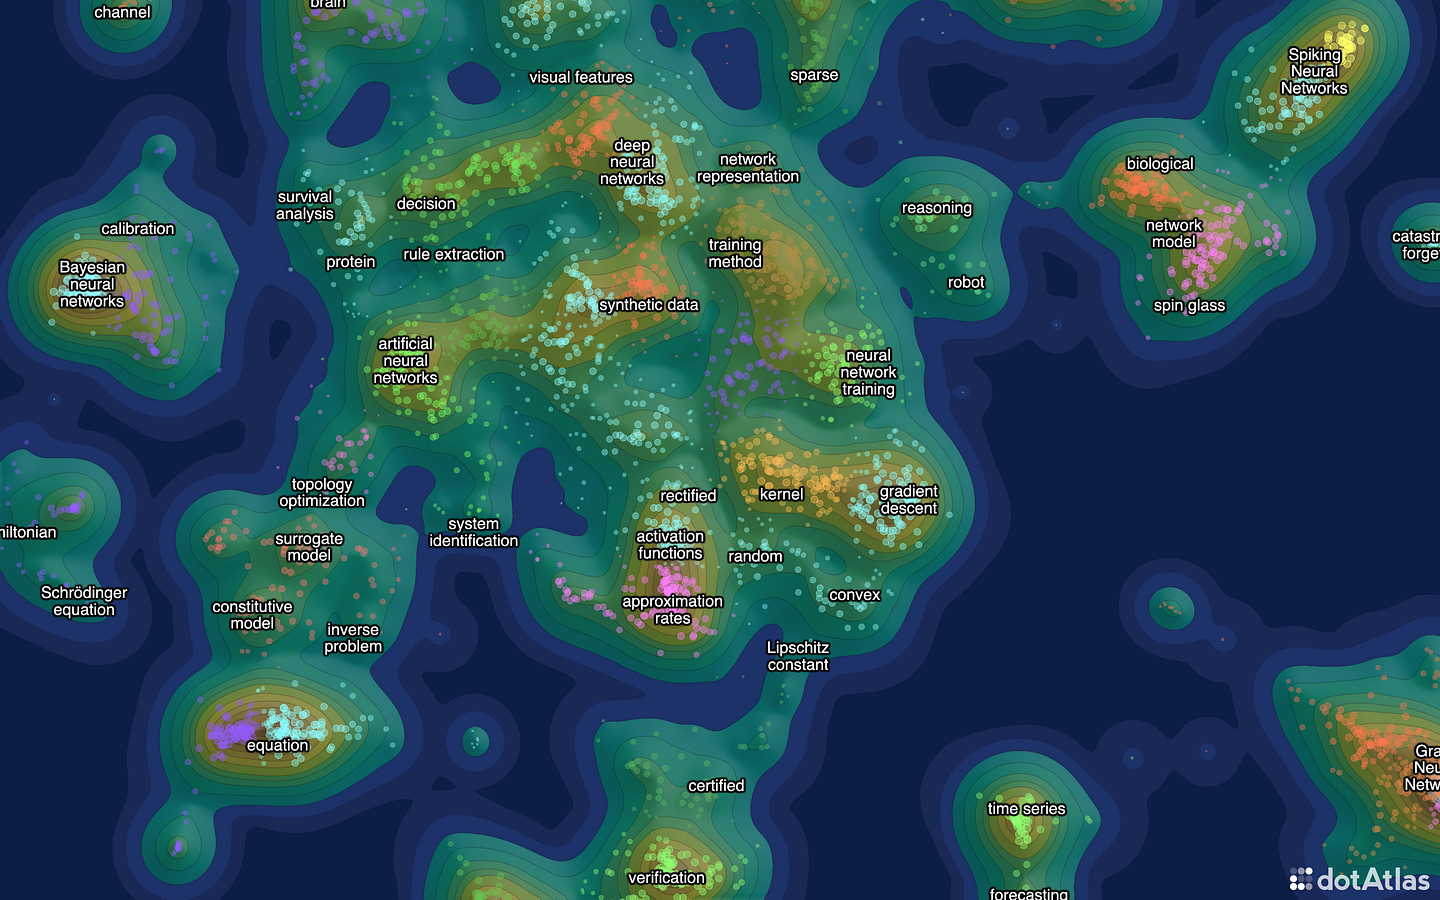
Elevation layer
Add depth to your data with an elevation layer for a topographic map-like experience.
The elevation layer creates a topographic map-like visualization that can add depth to your data. Points with higher elevation values appear as peaks, while points with lower values form valleys.
This creates a visually appealing and intuitive way to represent the importance or density of points in your dataset.
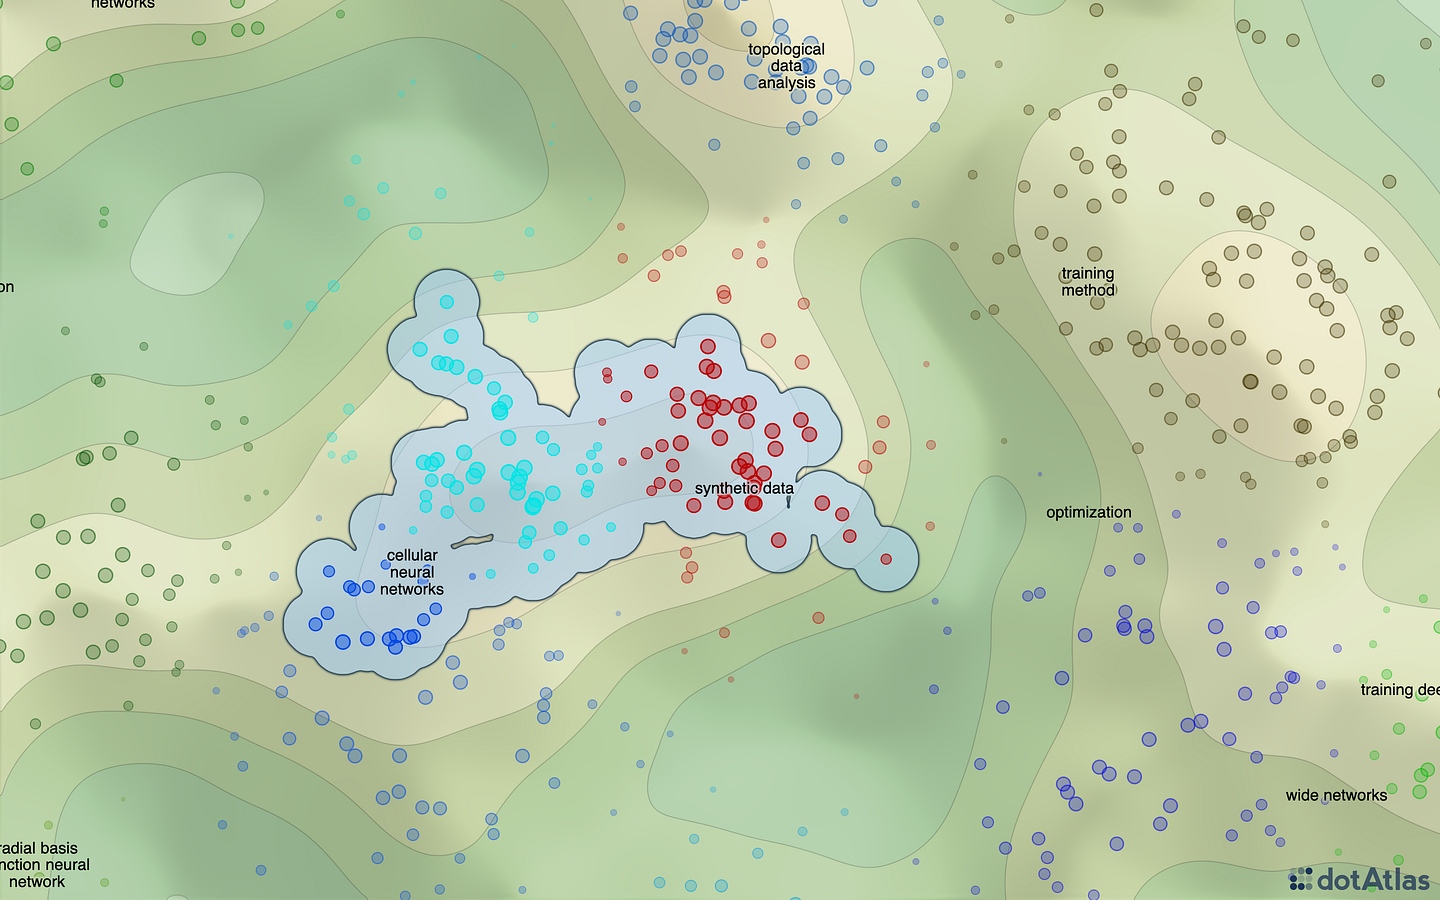
Outline layer
Highlight important areas of your 2D embedding with one or more outline layers.
Stack one or more outline layers on top of your visualization to highlight specific groups of points, for example the points the user selected for further inspection.
Plugins add high-level features
Dark mode, hover and selection tracking, nearby point clustering, elevation value legend and more.
Plugins use the core dotAtlas API to implement higher-level features, such as dark mode or hover and selection tracking. The source code of all plugins is available for inspection and modification.
Lingo4G integration
Visualize Lingo4G document embeddings and clusters as an interactive map using a dedicated plugin.
dotAtlas integrates with Lingo4G to visualize document embeddings and clusters as an interactive map. Each marker represents a document, and similar documents appear close together on the map.
Smooth even with 1M+ points
Visualize millions of points at once, enjoy responsiveness and smooth interactions.
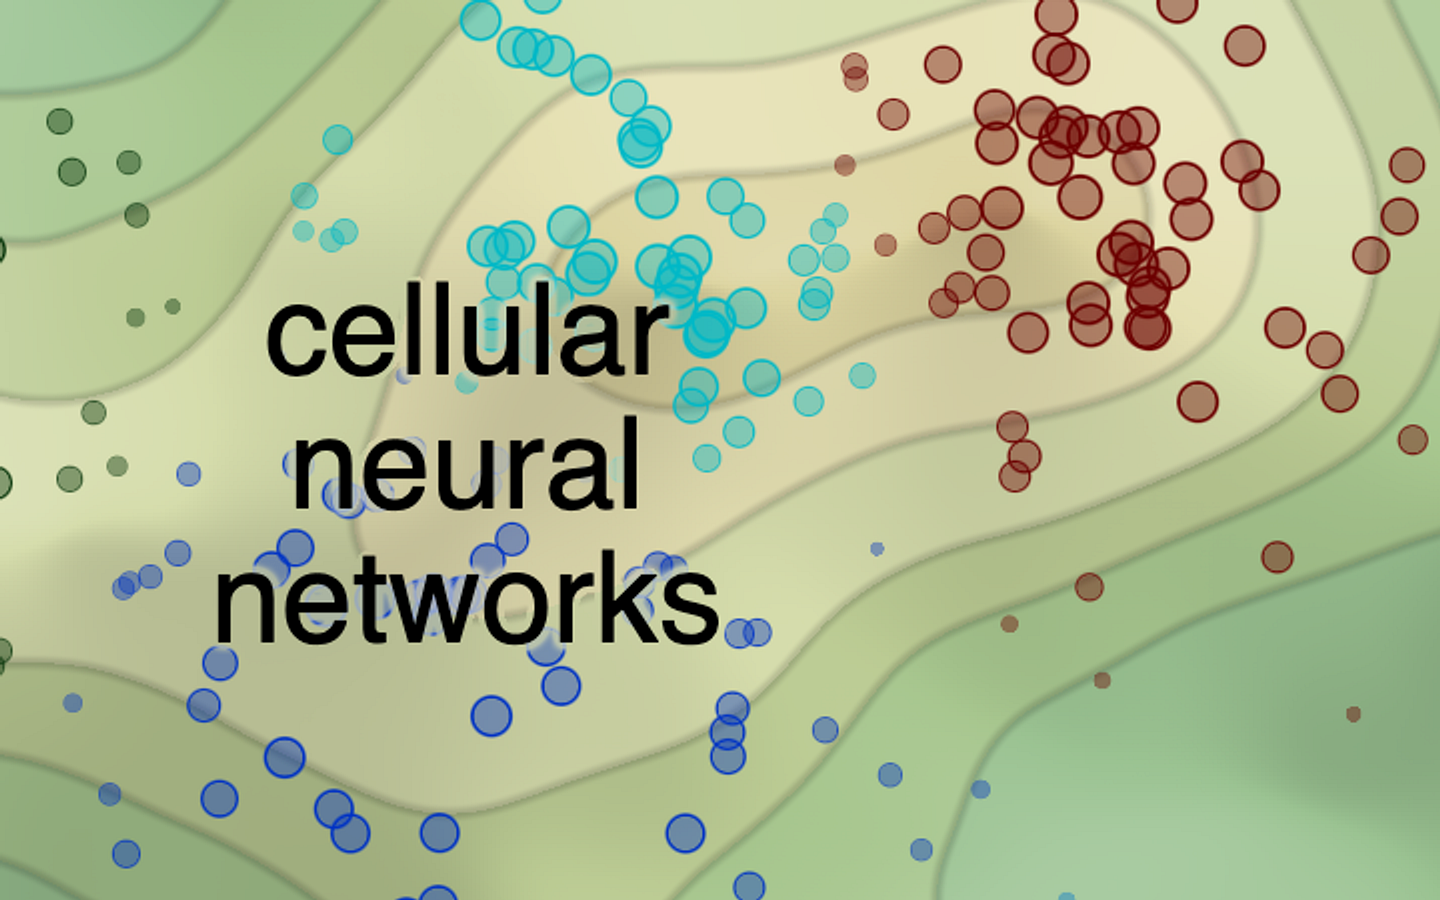
Attention to detail
Realistic map-like rendering with light shading and broken contours for better visibility of labels.

Fluid 60 FPS interactions
Implemented in WebGL for blazing fast interactions, also with large data sets.

PNG and JPEG export
Export visualizations to PNG or JPEG images for offline use.

Questions & Answers
What are the requirements of dotAtlas?
dotAtlas requires JavaScript, HTML5 canvas, and WebGL support. It works on any major desktop browser, including Chrome, Edge, Firefox, and Safari.
Are mobile devices supported?
dotAtlas does not currently support mobile devices. Based on user interest, dotAtlas may support mobile browsers in the future, possibly with a limited set of available layer types or slightly degraded rendering quality.
Does dotAtlas require Lingo3G or Lingo4G to run?
No, dotAtlas can be used independently of Lingo3G or Lingo4G. Of course, it will also be an excellent tool to visualize document embeddings and clusters you get from our clustering engines, especially Lingo4G.
How is dotAtlas licensed?
The most common dotAtlas licensing scenarios are for use in SaaS applications and Intranet deployments. We require one dotAtlas license per one SaaS application, regardless of the number of servers handling the application and the number of users. Similarly, we require one dotAtlas license per deployment in one Intranet, regardless of the number of servers and users.
Each license comes with 12 months of software maintenance, covering support and all upgrades. For non-typical deployment scenarios, such as OEM distribution, please get in touch.
What is the cost of a dotAtlas license?
Please contact us for a quote.
Is there a free version?
Yes, you can use the demo version, which displays the dotAtlas logo, free of charge. The demo version is otherwise fully-functional.