
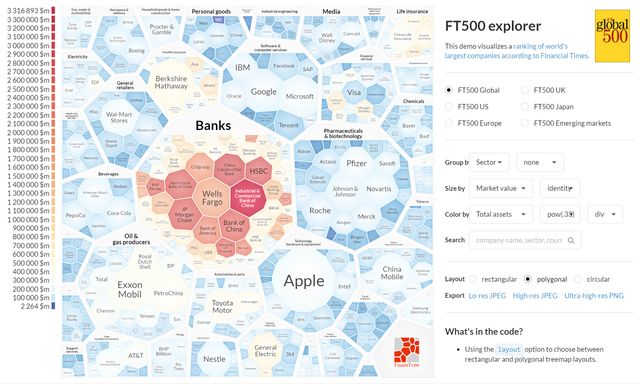
FoamTree is a great tool to visualize all kinds of hierarchical data.
This screen shot shows a demo application that visualizes companies from the Financial Times FT 500 list. Companies are grouped into a 2-level hierarchy by sector, size of the cells corresponds to the market value of the company, color depicts the p/e ratio.
Efficient browsing of hierarchical data. And fun too.
FoamTree is a JavaScript Voronoi treemap visualization. Innovative layouts, animated interactions, endless customization.
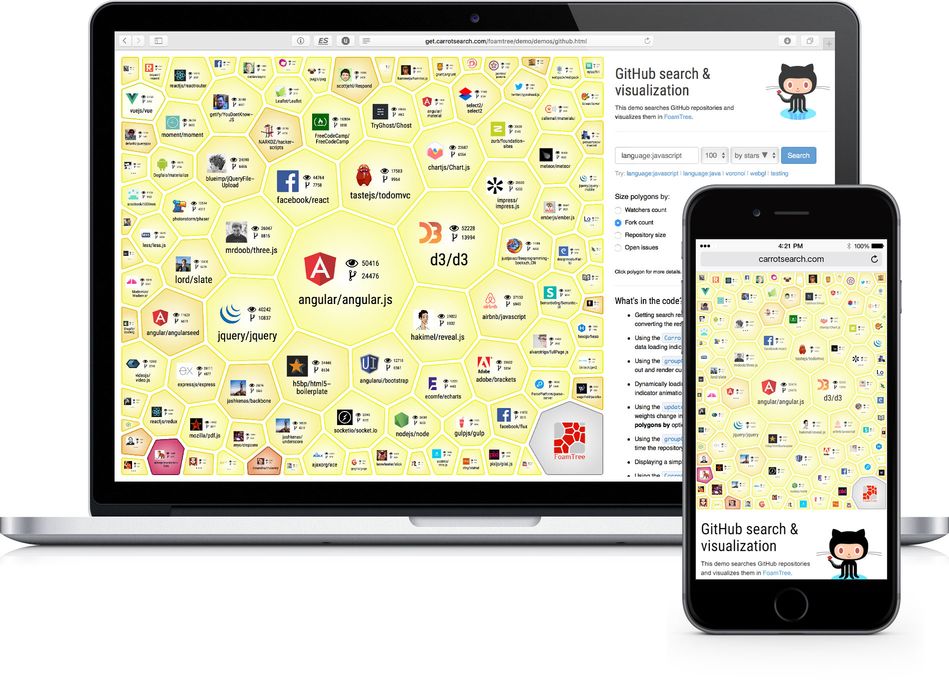
Great on desktop and mobile
FoamTree is a JavaScript HTML5 component. It will work in any modern browser, both on desktop and mobile platforms.
Countless applications
Our customers use FoamTree to present a broad range of data: word clouds, news highlights, financial results, photos, site maps and more.
Great experience out of the box
For stunning results, level up and write a little customization code. We can help with that.
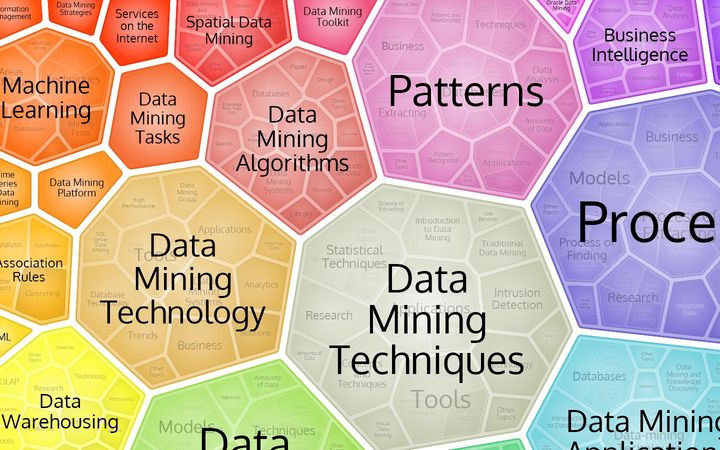
Non-rectangular layouts
Visually pleasing non-rectangular layouts efficiently use the available space.
FoamTree's default layout is based on Voronoi power diagrams. It divides the available space into convex polygons, creating organic-looking arrangements.
The screen shot shows FoamTree visualization of the 3-level cluster structure generated by Lingo3G for 500 web search results for query data mining. View the settings panel demo for the interactive version.
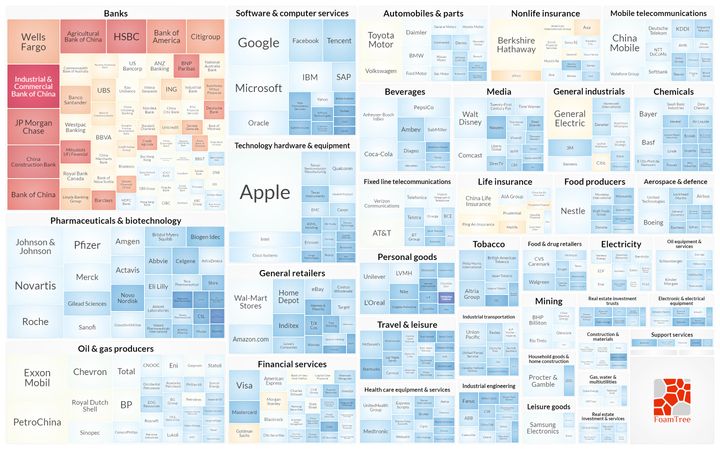
Rectangular treemaps
Traditional squarified and ordered rectangular treemaps are also supported.
FoamTree also supports the traditional rectangular treemaps. Currently available are the squarified and ordered layout variants.
The screen shot shows FT500 Global companies grouped by sector. Cell size indicates market value, color corresponds to total assets. The interactive version is available in the FT500 demo.
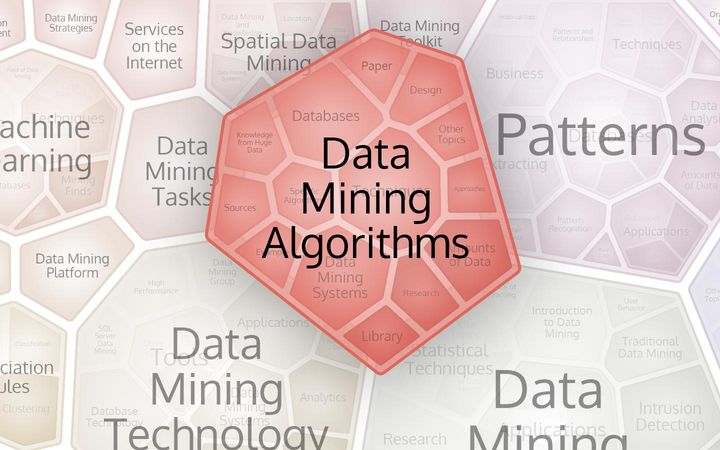
Zooming and exposing
Animated zooming and expose interaction for browsing of deeply nested hierarchies.
To better explore deep hierarchies, users can zoom into the areas of interest or 'expose' individual groups.
The screen shot shows the Data Mining Algorithms group exposed. To see zooming in action, double-click cells in the Tree of Life demo. For the expose effect, double-click groups in the Photo explorer demo.

Endless customizations
Custom content in each cell, including additional text, shapes or images.
By writing some extra code, you can draw arbitrary content in each FoamTree cell. The screen shot shows the Photo explorer demo which displays daily top Flickr photos in FoamTree. Notice that the exposed cell's content consists of the individual photo, its title, author and view count below. The blurred version of the photo serves as the cell's backdrop.
Incidentally, the screen shot shows some spectacular photos of Poznan, Poland (where Carrot Search is based) by Erik Witsoe.
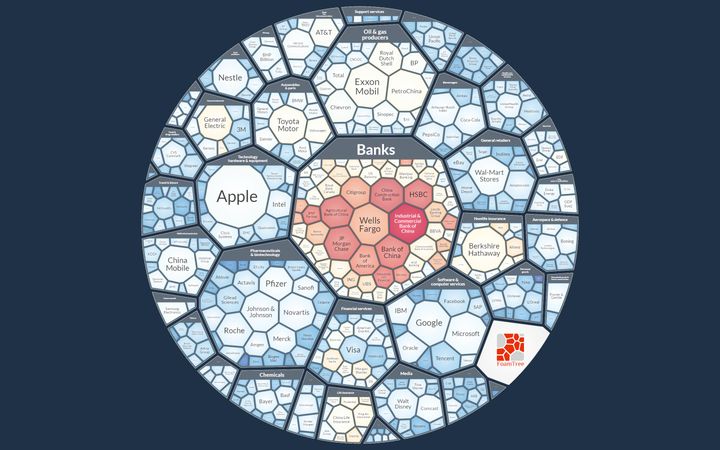
Non-rectangular containers
Embedding Voronoi treemaps in any convex shape, such as a circle or diamond.
FoamTree can put polygonal Voronoi diagrams into any convex container, such as a triangle, hexagon or a circle.
Shown in the screen shot are FT500 companies grouped by sector and embedded in a circular container. View the FT500 demo for an interactive version.
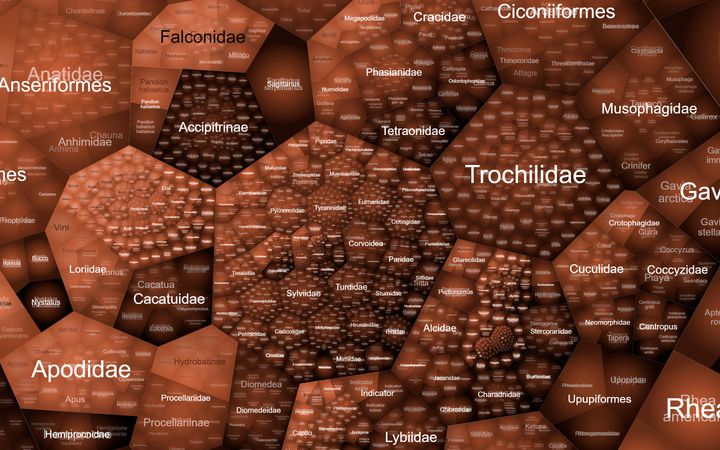
Support for very large hierarchies
Handling of hierarchies with 100k+ nodes on 100+ levels, such as the tree of life data.
With lazy-loading and progressive disclosure, FoamTree makes it possible to browse deeply-nested hierarchies of 100k+ nodes and more.
The screen shot shows a selected part of the Tree of Life hierarchy with more than 100k nodes and the maximum of 37 nesting levels. Go to the Tree of Life demo for an interactive version.
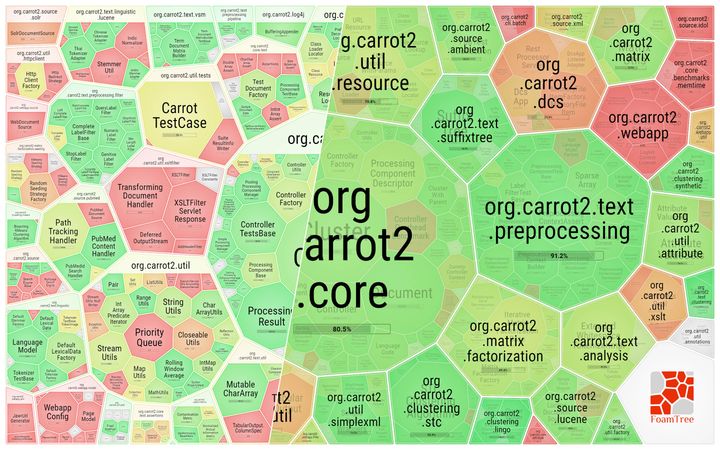
Flattened and hierarchical stacking
All levels visible at once or in a top-down progressive disclosure arrangement.
FoamTree can display the polygonal and rectangular treemaps in two arrangements. On the left is the flattened arrangement where all levels of the hierarchy are visible at once. On the right is the hierarchical arrangement where only the top level of the hierarchy is visible and the user can click-and-hold specific groups to "open" them for further inspection.
The screen shot shows unit test coverage of the open source Carrot2 document clustering engine generated by Atlassian Clover. See the coverage demo for an interactive version.
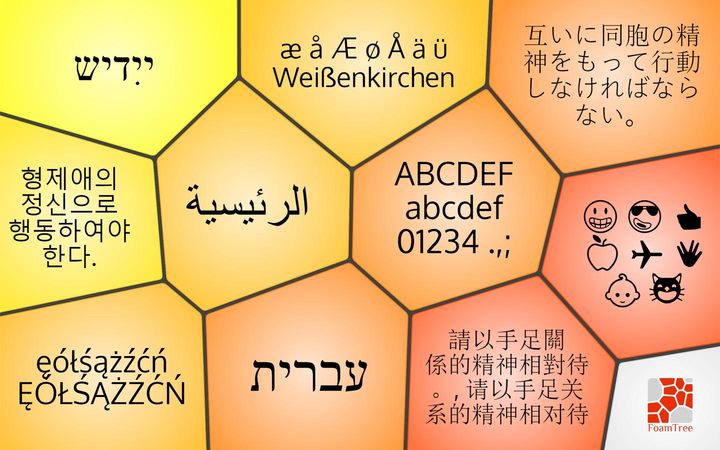
Multilingual and emoji-friendly
Supports all special characters your browser can display, including emoji.
FoamTree can display all the characters your browser can render, including Arabic, Chinese, Japanese, Korean as well as emoji.
View the settings demo and choose the multilingual data set there for an interactive version.
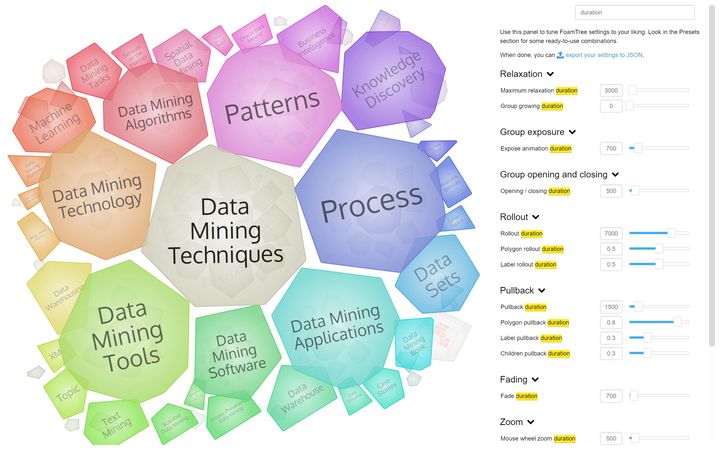
Animated transitions
Multitude of animation parameters can create tens of rollout and pullback effects.
FoamTree uses animated transitions for zooming, exposing as well as revealing and replacing visualized data. Using a wide array of parameters, you can create your own data rollout and pullback effects.
The screen shots shows the settings panel demo and a frozen frame of one data rollout animation.
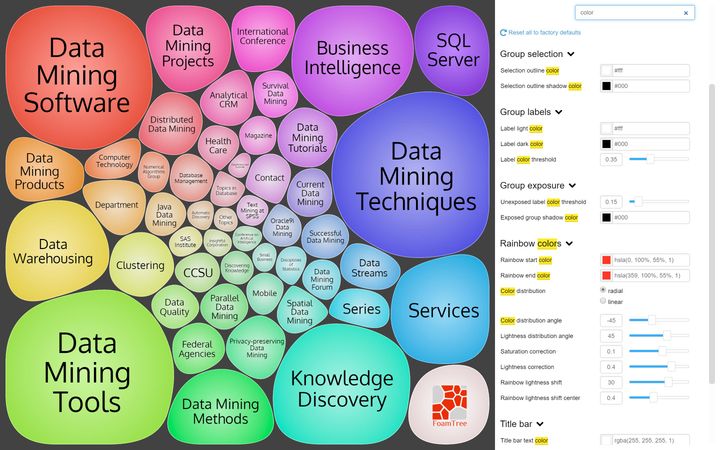
Extensive tuning
Settings panel for tuning of visual properties and exporting them to your Java code.
You can tune various aspects of the look and behavior of FoamTree, including cell layout, colors and borders, label fonts and sizes, animation speeds and easing functions.
The screen shot shows the settings panel demo with settings altered to get near-round shapes of FoamTree cells.
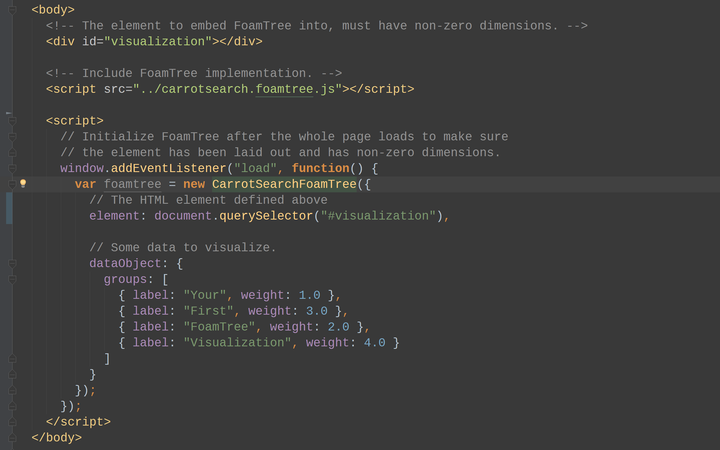
JavaScript and JSON API
Get started within minutes. FoamTree is a small JavaScript library, 43kB gzipped.
To get your first visualization, pass a HTML element and some data to FoamTree constructor. See FoamTree API reference for detailed documentation of all available options.

Questions & Answers
What are the requirements of FoamTree?
FoamTree requires JavaScript and HTML5 canvas support. It will work on any major browser, including Chrome, Firefox, IE10+, Edge and Safari.
Will FoamTree run on mobile devices?
Yes, FoamTree will run on Android and iOS phones and tablets. Touch-enabled laptops are also supported.
Does FoamTree require Lingo3G or Lingo4G to run?
No, FoamTree can be used independently of Lingo3G or Lingo4G. Of course, it will also be an excellent tool to visualize clusters you get from our clustering engines.
What hierarchy depth does FoamTree support?
FoamTree supports hierarchies of any depth. To aid visualization of very large data sets, such as the Tree of Life data with 100k+ nodes on 100+ levels, FoamTree offers lazy-loading of data and progressive disclosure of groups.
How is FoamTree licensed?
The most common FoamTree licensing scenarios are for use in SaaS applications and Intranet deployments. We require one FoamTree license per one SaaS application, regardless of the number of servers handling the application and the number of users. Similarly, we require one FoamTree license per deployment in one Intranet, regardless of the number of servers and users.
Each license comes with 12 months of software maintenance, covering support and all upgrades. For non-typical deployment scenarios, such as OEM distribution, please get in touch.
What is the cost of a FoamTree license?
Please contact us for a quote.
Can I get a discount?
Yes, we offer a 50% discount for holders of valid Lingo3G or Lingo4G licenses.
Is there a free version?
Yes, you can use the demo version, which displays FoamTree logo in one of the cells, free of charge. The demo version is otherwise fully-functional.